Some years ago after a cousin of mine had a major blood pressure related incident that eventually resulted in his death, his doctor suggested that extended family have their blood pressure checked. I had mine checked, not thinking for a minute there would be any issues. I was a fairly healthy weight, didn’t smoke, eat much crap or over drink and I played football regularly as well as lots of walking and occasional swimming. I remember feeling really annoyed that my blood pressure was very high while still in my 30s, high enough to require medication that I’m still on now 10 years later and probably will be for life. I’d never had any major health issues before. The first one is always hard. Suddenly you’re not young and immortal anymore!
I got myself a blood pressure monitor as recommended by my doctor and as I was manually writing down the readings each Wednesday, running out of space, losing pens etc.. I decided to do some research and create a spreadsheet to better keep track of my readings and give me visual alerts if they got dangerously high. I’d like to make this spreadsheet freely available to others as I find it very useful.
How it works:

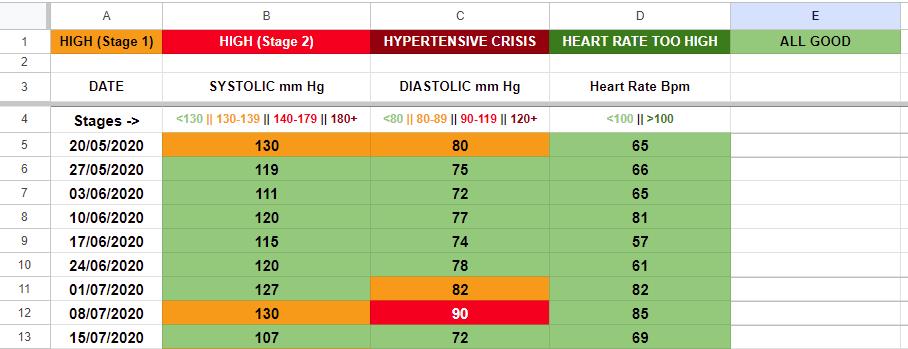
You add the date of the reading in the DATE column then input your readings for both SYSTOLIC (number on top) and DIASTOLIC (number on bottom) pressure in the relative columns. I always take readings twice and input the average readings of the two. Take the readings early morning when you’re relaxed and not stressed. And definitely not after physical activity. Most blood pressure monitors give a heart rate reading too so I’ve included that in the last column.
The spreadsheet has some background calculations and conditional colour formatting that change the colour of the cells you input readings to depending on which stage your readings fall into. So for example if the cell is light green as most of them are above, that means your blood pressure is within normal ranges. If they are orange, your pressure is elevated, if they are red your pressure is getting dangerously high and if they are dark red you are risking a major hypertensive crisis like a heart attack or stroke and you should seek medical attention asap.
Using this spreadsheet once or even twice a week can help you monitor your blood pressure condition more effectively and let you know when you should see your doctor.
NB – this spreadsheet and any advice contained in this blog are not medical advice and you should still get regular blood pressure checks and halter monitors from your doctor.
Update September 2023 – Added average values and support for low blood pressure.
You can download the latest spreadsheet HERE.
In memory of Richard Roche 1970 – 2018.
